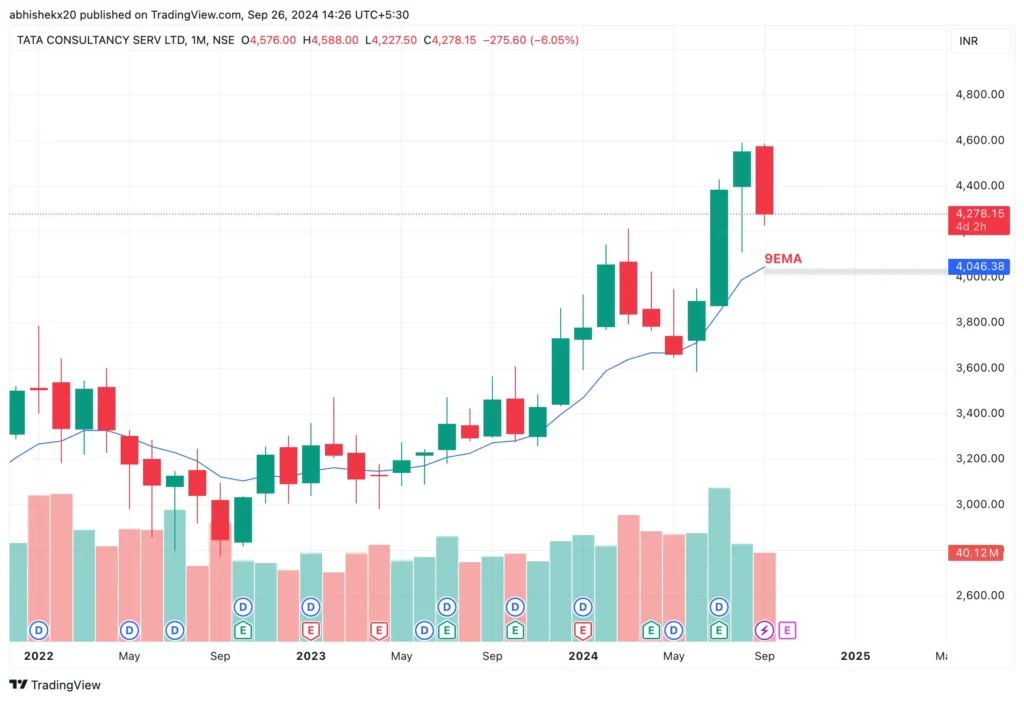
9EMA, or Nine Exponential Moving Average. This tool is important in the stock market. It helps traders make better decisions. In this article, we will explain what 9EMA is, how it works, and why it matters.
What is 9EMA?
The 9EMA is a type of moving average. Moving averages help smooth out price data over a specific period. This smoothing makes it easier to see the overall trend. The “exponential” part means that the most recent prices have more influence. This makes the 9EMA react more quickly to price changes compared to other types of moving averages, like the simple moving average.
How is 9EMA Calculated?
To calculate the 9EMA, you need historical price data. Here’s a step-by-step process:
- Collect Closing Prices: Gather the closing prices of the last nine days.
- Calculate the Average: Add these prices together and divide by nine. This gives you the simple average.
- Apply the Exponential Formula: Use the exponential formula to give more weight to the most recent prices. This requires a specific multiplier.
- Use Trading Platforms: Many trading platforms can automatically calculate the 9EMA, saving time for traders.
Why Use 9EMA?
Traders use the 9EMA for several important reasons:
Trend Identification:
- If the current price is above the 9EMA, it often signals an upward trend.
- If the price is below the 9EMA, it may indicate a downward trend.
- This helps traders decide whether to buy or sell.
Support and Resistance Levels:
- Support levels are prices where stocks tend to stop falling.
- Resistance levels are prices where stocks tend to stop rising.
- If a stock price bounces off the 9EMA, it may suggest that the level is strong and can act as support.
The Role of 9EMA in Trading Strategies
Many traders include the 9EMA in their trading strategies. Here are a few common ways it is used:
Crossovers:
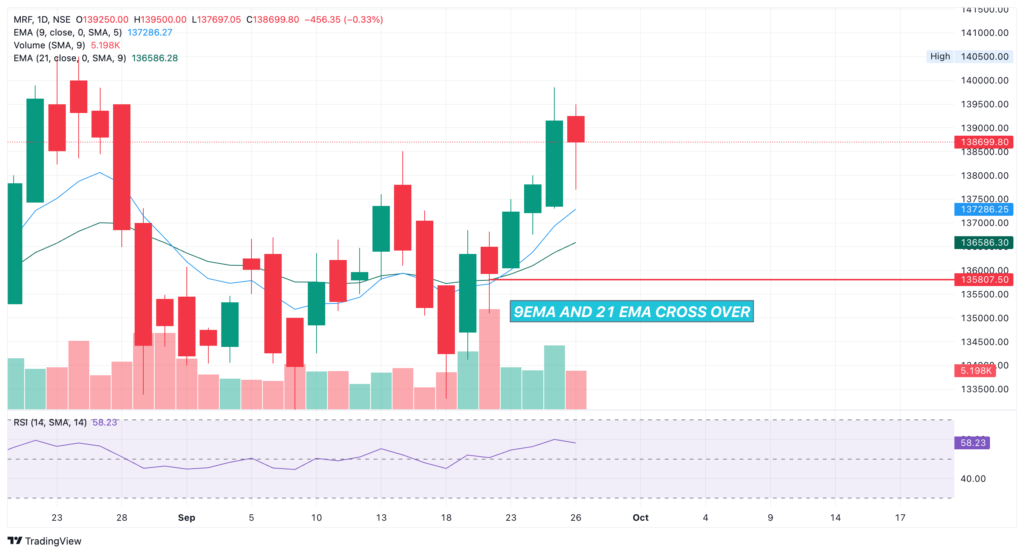
- A crossover happens when the 9EMA crosses another moving average, like the 21-day moving average.
- For example, if the 9EMA crosses above the 21EMA, it can signal a buying opportunity.
- Conversely, if it crosses below, it may indicate a selling opportunity.

Here is a simple table to illustrate potential crossover scenarios:
| Date | Price | 9EMA | 21EMA | Crossover Signal |
|---|---|---|---|---|
| 2023-09-20 | 100 | 98 | 97 | No Crossover |
| 2023-09-21 | 102 | 99 | 97.5 | No Crossover |
| 2023-09-22 | 101 | 100 | 98 | No Crossover |
| 2023-09-23 | 105 | 101 | 98.5 | 9EMA crosses above 21EMA (Buy Signal) |
| 2023-09-24 | 107 | 102 | 99 | No Crossover |
| 2023-09-25 | 106 | 103 | 99.5 | No Crossover |
| 2023-09-26 | 104 | 102 | 99.75 | No Crossover |
Confirmation with Other Indicators:
- Traders often use the 9EMA alongside other indicators, like the Relative Strength Index (RSI) or the MACD.
- This combination helps confirm trading signals, making them more reliable.
Limitations of 9EMA
While the 9EMA is helpful, it has some limitations:
False Signals:
- Like any indicator, the 9EMA can give false signals.
- During volatile market conditions, it might react too quickly, leading to wrong decisions.
Not a Standalone Tool:
- The 9EMA should not be used by itself.
- It is essential to combine it with other forms of analysis.
- Fundamental analysis and current market news are also important.
For more updates on Technology and related news, check out other articles on moneyphobia.

