Last updated on June 16th, 2025 at 05:04 pm
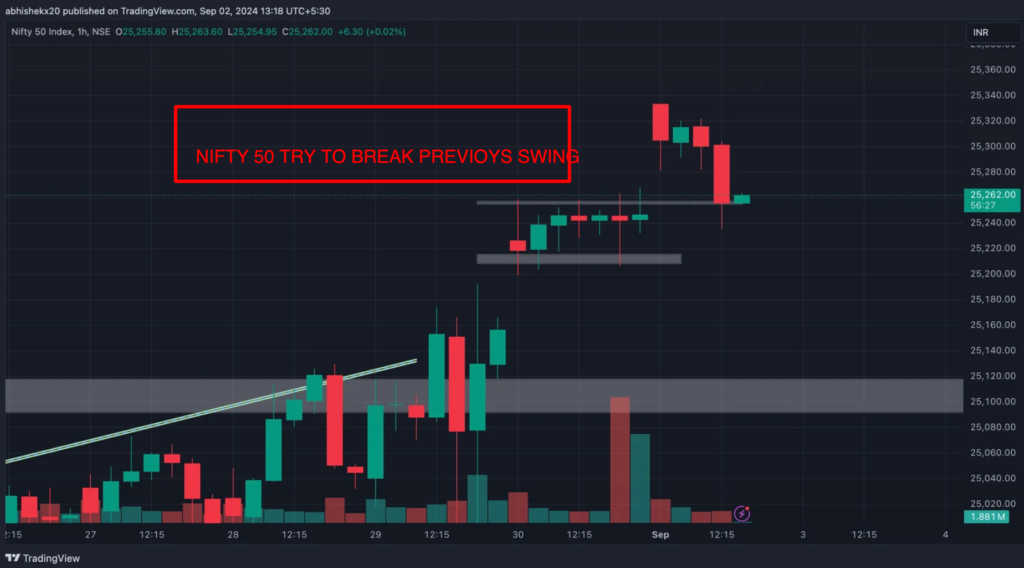
On September 2, 2024, the Nifty 50 Index displayed resilience amidst fluctuating market conditions. The Nifty 50, a crucial benchmark for the Indian stock market, managed to close at 25,260.00 INR, marking a modest gain of 4.30 points or 0.02% from the previous session.
Market Overview
The trading session on September 2 was characterized by significant volatility. The market opened slightly higher at 25,255.80 INR and reached an intraday high of 25,260.00 INR. However, it also dipped to an intraday low of 25,254.95 INR before stabilizing at the closing price.
Key Observations from the Chart
The hourly candlestick chart highlights the market’s attempt to break above the previous resistance levels. Initially, the index showed strength, pushing upward. But as the session progressed, selling pressure emerged, leading to a sharp decline. The red candles indicate the bearish sentiment that took hold during the latter part of the trading day.
Despite the downward pressure, the index found support at a crucial level. The green candle forming near the end of the session suggests that buyers stepped in to defend the support zone, preventing further losses. This support level, as indicated in the chart, has played a critical role in the recent trading sessions.
Volume Analysis
The volume data, represented by the bars at the bottom of the chart, provides additional insights. On September 2, trading volume was relatively higher during the downward move, signaling strong participation from sellers. However, the volume during the recovery phase was comparatively lower, suggesting that the buying interest was not as robust. This divergence between price action and volume may indicate caution among market participants.
Technical Indicators and Levels
The chart also reveals some key technical levels that traders are likely to watch in the coming sessions. The index faced resistance near the 25,300 INR level, where multiple attempts to break above were met with selling pressure. This level now serves as a significant barrier that the index needs to overcome to continue its upward trajectory.
On the downside, the 25,200 INR level has emerged as a strong support zone. The market’s ability to hold above this level will be crucial in determining the short-term direction of the index. A break below this support could lead to further downside pressure, potentially testing the next support level near 25,100 INR.

For Advertising, Guest Posting, Newsletter Inserts please contact [email protected]. For general enquiries contact [email protected].


