In the stock market, understanding the intricacies of options trading is crucial. One important concept to grasp is “Vega.” Vega measures how sensitive an option’s price is to changes in the volatility of the underlying asset. For those new to trading, this can seem complex. However, breaking it down into simpler terms can help you understand its significance and how it impacts your trading decisions.

What is Vega?
Vega represents the amount by which the price of an option is expected to change for a 1% change in the volatility of the underlying asset. In simpler words, it tells us how much the price of an option will change if the market becomes more or less volatile.
Positive Vega
Both call and put options have positive Vega. This means that when the volatility of the underlying asset increases, the price of both call and put options generally increases. Higher volatility means more uncertainty about the future price of the underlying asset. This uncertainty makes options more valuable because the potential for large price movements increases.
At-the-Money (ATM) Options
Options that are “at-the-money” (ATM) have the highest Vega. An ATM option is one where the current price of the underlying asset is very close to the option’s strike price. Small changes in volatility have a larger impact on the price of ATM options compared to options that are “in-the-money” (ITM) or “out-of-the-money” (OTM).
Vega and Time to Expiration
Vega decreases as the option approaches its expiration date. This means that longer-term options have higher Vega compared to short-term options. The further away the expiration date, the greater the potential for significant price movements, hence higher Vega.
Graphical Representation
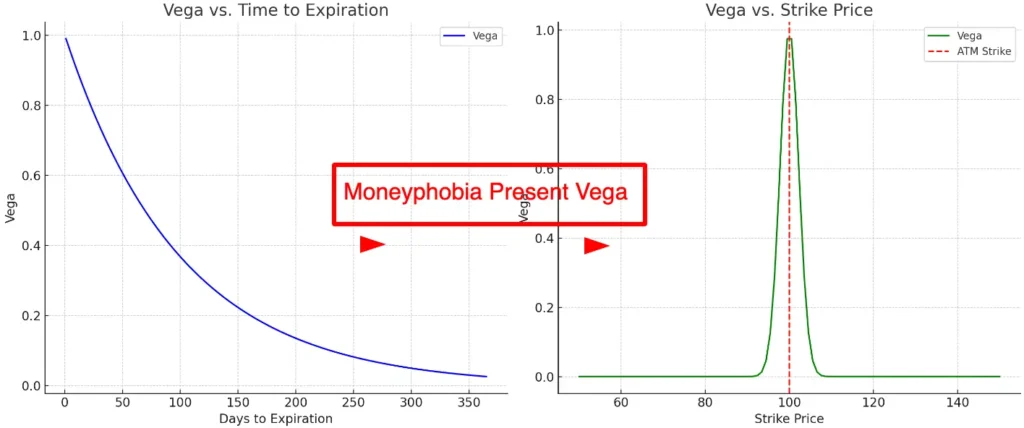
To visualize Vega, let’s look at two graphs:
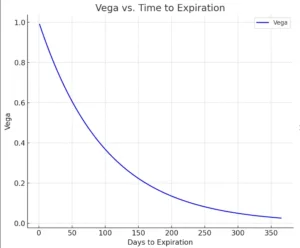
Vega vs. Time to Expiration
This graph shows how Vega changes as the option approaches its expiration date. The Vega of an option decreases as the expiration date nears, indicating that options with more time remaining until expiration are more sensitive to changes in volatility.
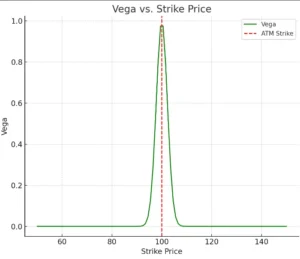
Vega vs. Strike Price
This graph shows how Vega varies with different strike prices for an option with a fixed expiration date. Options that are at-the-money have the highest Vega. This demonstrates that these options are most affected by changes in volatility.
Importance of Vega in Trading
Understanding Vega is crucial for options traders. It allows them to gauge the impact of volatility on their positions. For example, if you expect the market to become more volatile, you might want to buy options because their prices are likely to increase. Conversely, if you expect volatility to decrease, selling options might be more profitable as their prices are likely to drop.
Practical Implications
Let’s consider a real-world example. Suppose you own a call option on Company XYZ with a strike price of $100, and the current price of XYZ is also $100 (ATM). If the volatility of XYZ’s stock increases from 20% to 21%, and the Vega of your option is 0.15, the price of your option would increase by $0.15 per share. If the option contract covers 100 shares, the total increase in the option’s price would be $15.


