Last updated on December 19th, 2024 at 09:09 pm

Welspun Corp Ltd has shown strong performance in the stock market recently. Investors are keeping a close eye on its movement, as the stock continues its bullish journey. Let’s dive deeper into the technical analysis of its monthly and daily charts to understand its trends, support, and resistance levels.
Monthly Chart Analysis
The monthly chart highlights a clear long-term uptrend for Welspun Corp. The stock has been climbing steadily since mid-2023. It has made higher highs and higher lows, which confirms a strong bullish momentum. Here are some key points:
- Trend:
The stock is currently in a strong uptrend. Over the last few months, it has shown consistent gains with minimal pullbacks. This indicates that investors are confident in the stock’s growth potential. - Resistance Level:
The 800-820 range appears to be acting as a significant resistance. The stock is consolidating near this level, with smaller candlesticks indicating reduced volatility. - Support Level:
The 700 level has been a solid support in the recent months. Whenever the stock approaches this level, buyers step in, pushing the price higher. - Volume:
Volume analysis shows that trading activity increases during bullish movements. This means investors are actively buying into the uptrend.
Daily Chart Analysis
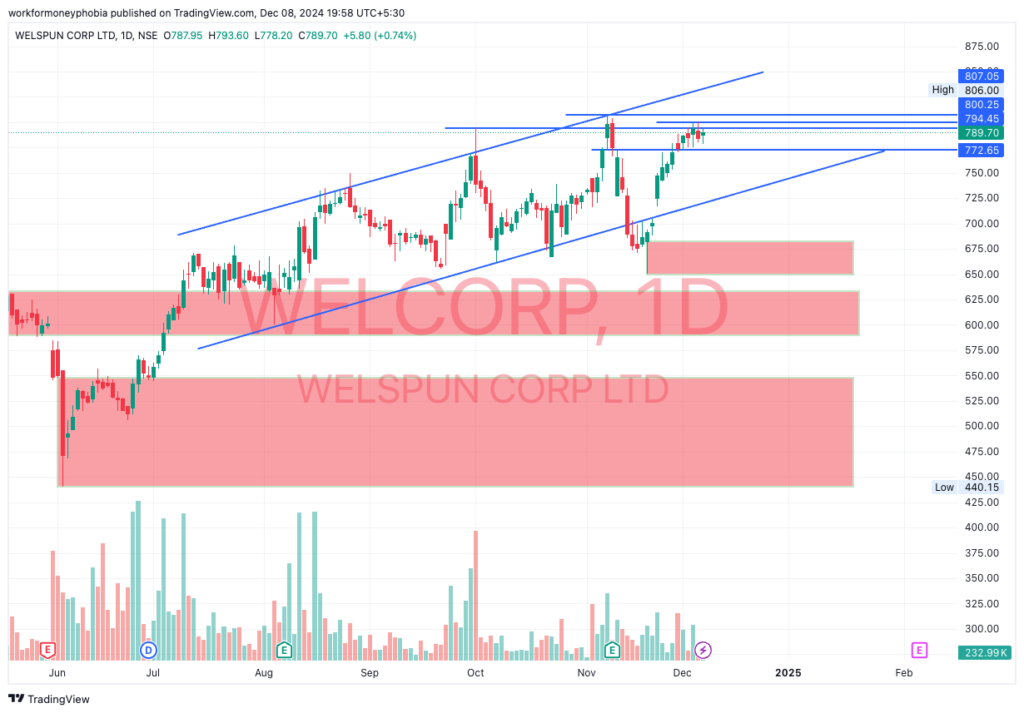
The daily chart provides a more detailed view of the stock’s short-term movements. The stock is trading within a clear ascending channel, which is a sign of a healthy uptrend.
- Ascending Channel:
The price is moving within an upward channel, defined by two blue trendlines. The lower trendline acts as support, while the upper trendline serves as resistance. Currently, the price is nearing the upper boundary of this channel. - Key Resistance:
The stock is testing the resistance around the 800-807 range. This level has been difficult to cross in the past, as sellers often step in at this point. - Key Support:
The 772 level provides immediate support. If the stock faces a pullback, this level could prevent further decline. Below that, the 675-700 range acts as a stronger support zone, highlighted by red demand areas. - Volume Insights:
Trading volume tends to increase when the stock nears the lower boundary of the channel. This suggests that buyers are accumulating shares during dips. However, as the price approaches resistance, volume decreases, indicating caution among traders.
What Could Happen Next?
The stock is currently at a critical point. Two scenarios are likely in the coming days:
- Bullish Breakout:
If the stock breaks above the 807 resistance level with strong volume, it could move higher. A breakout would confirm further bullish momentum. The next target could be 820 or even higher. - Pullback to Support:
If the stock fails to break above 807, it might pull back. The first level to watch for support is 772. If it goes lower, the 675-700 demand zone could attract buyers again.
Investor Takeaways
Welspun Corp Ltd is in a strong uptrend. The stock has solid support levels, which make it an attractive option for long-term investors. However, the resistance near 800-820 needs to be broken for the uptrend to continue.
For traders, it’s important to watch the ascending channel closely. Buying near the lower trendline (around 772 or lower) and booking profits near the resistance could be a good strategy. Long-term investors might wait for a breakout above 807 before adding more positions.